Key performance indicators are currently listed for each strategic objective.
However, please note that historical data, trends, and targets will be made available in the near future.
TRACKING PROGRESS
As we move forward together, we will regularly assess our performance, celebrate our achievements, and adjust our strategies as needed. Explore the key performance indicators we will utilize to track our progress towards each strategic objective to ensure that we are headed in the right direction, at the right pace, and with the right resources.
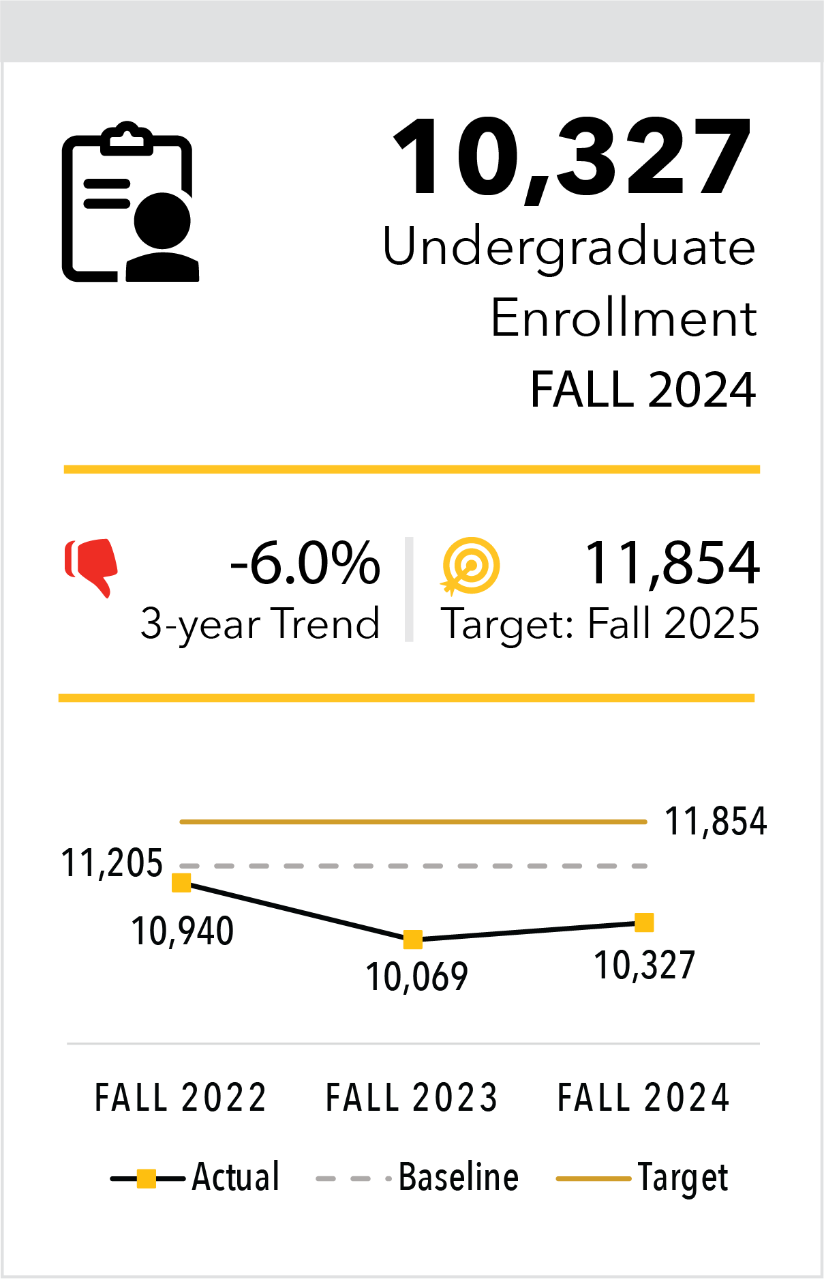
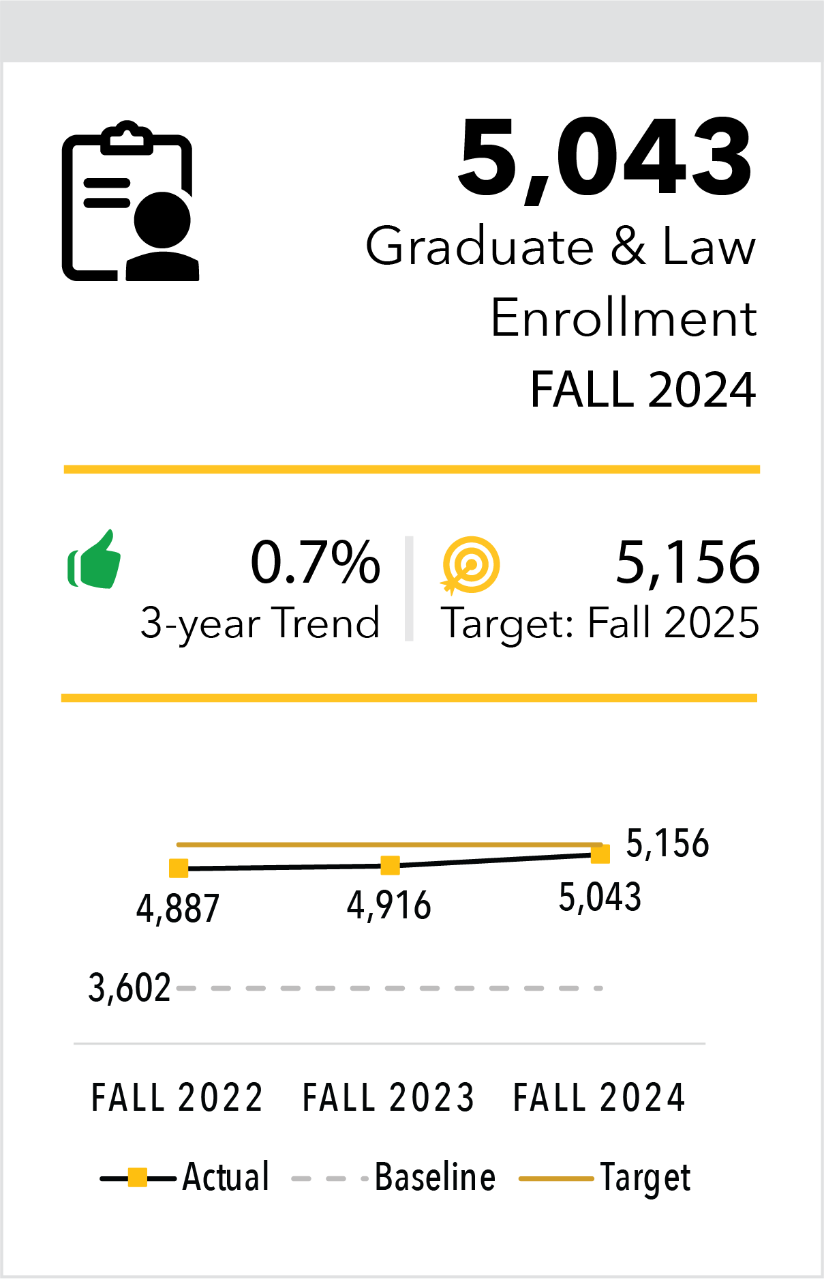
Our Students
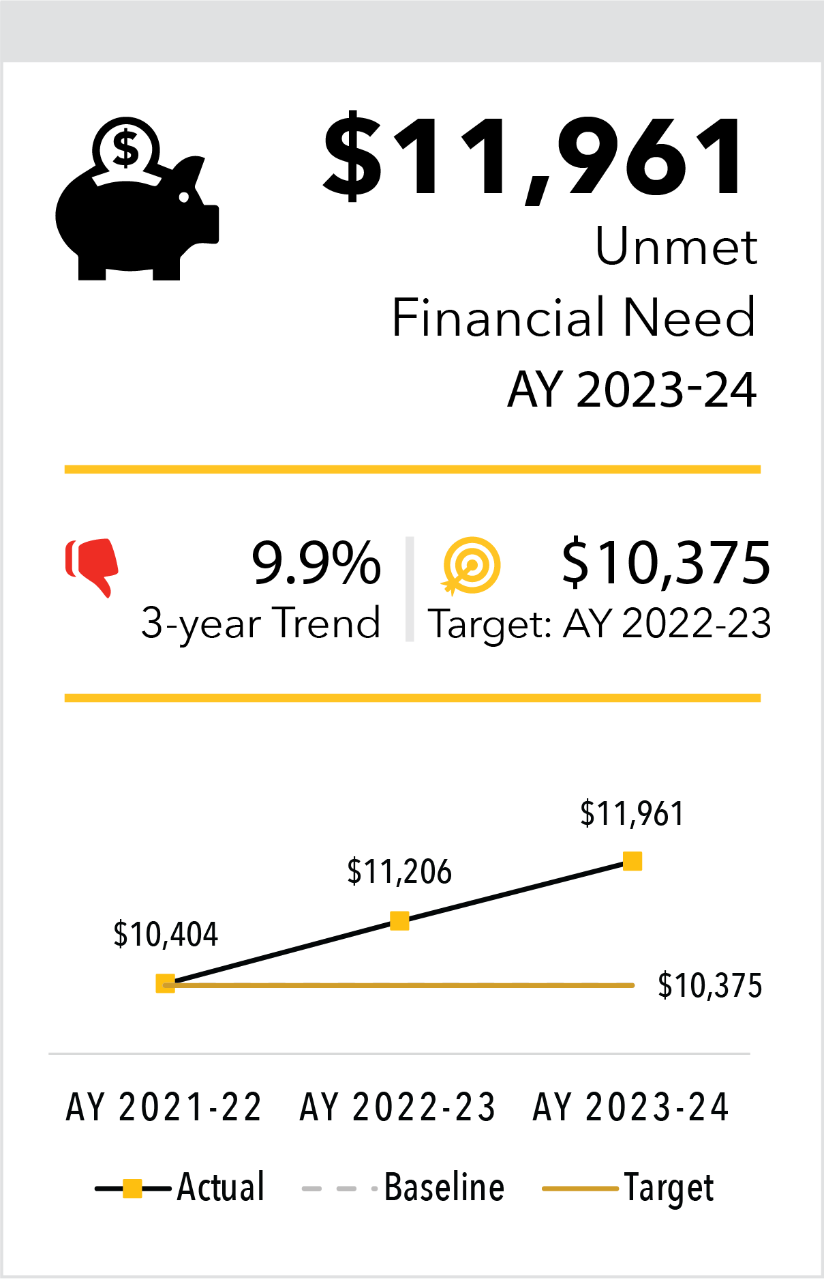
Enhance access to higher education
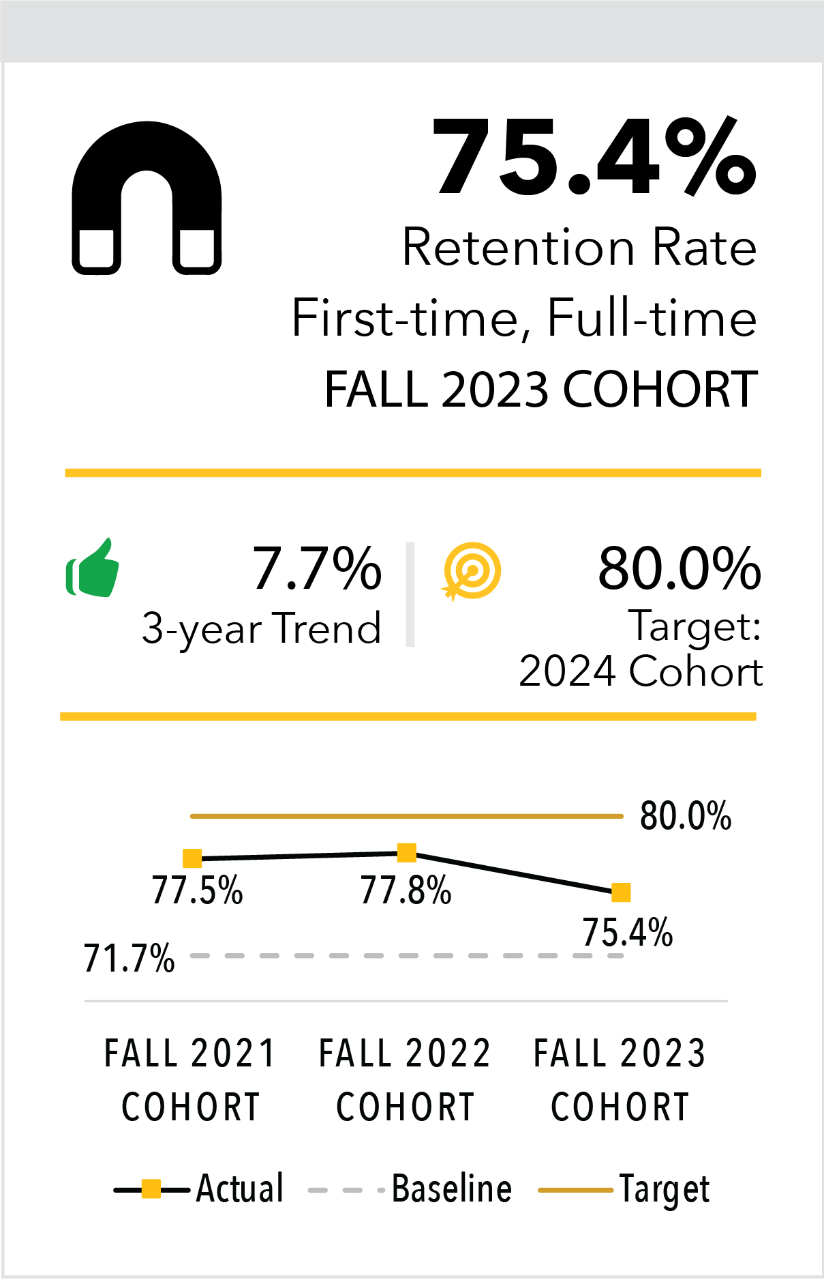
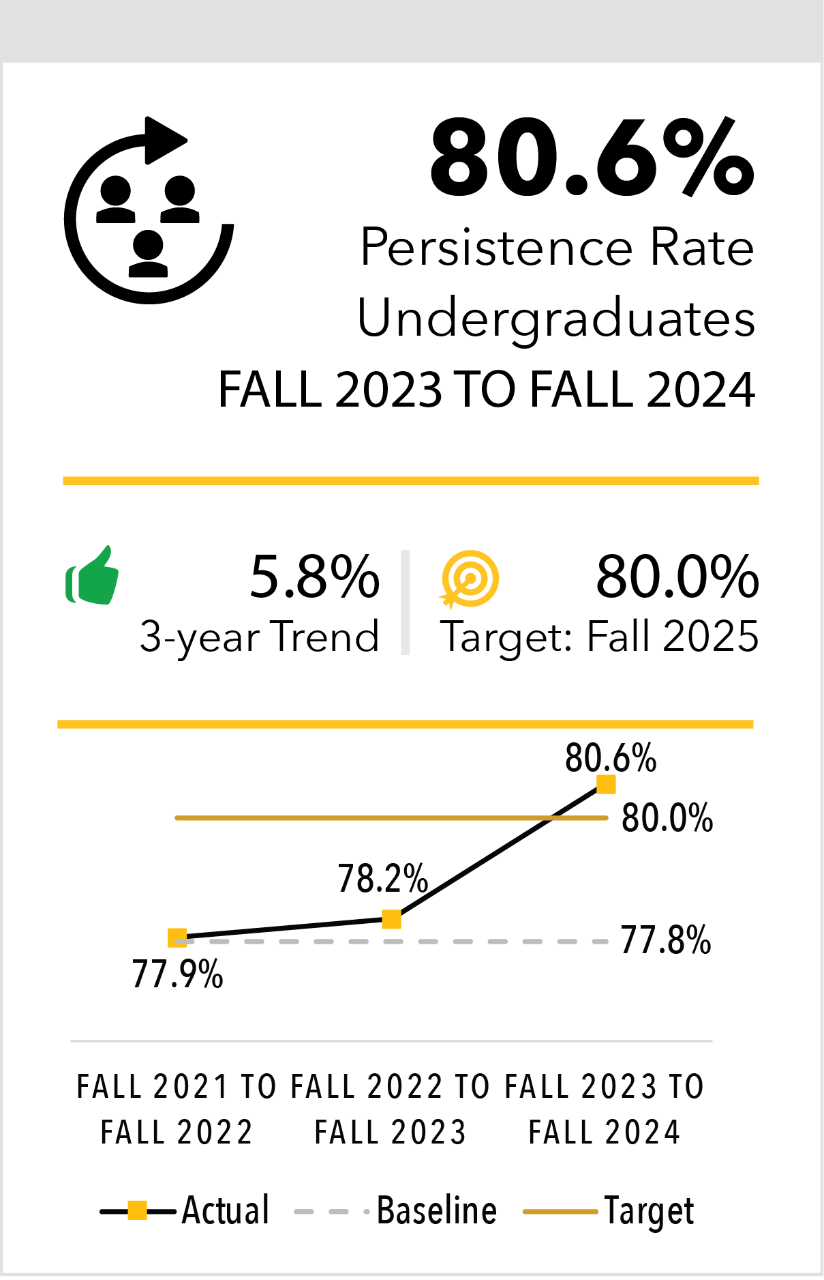
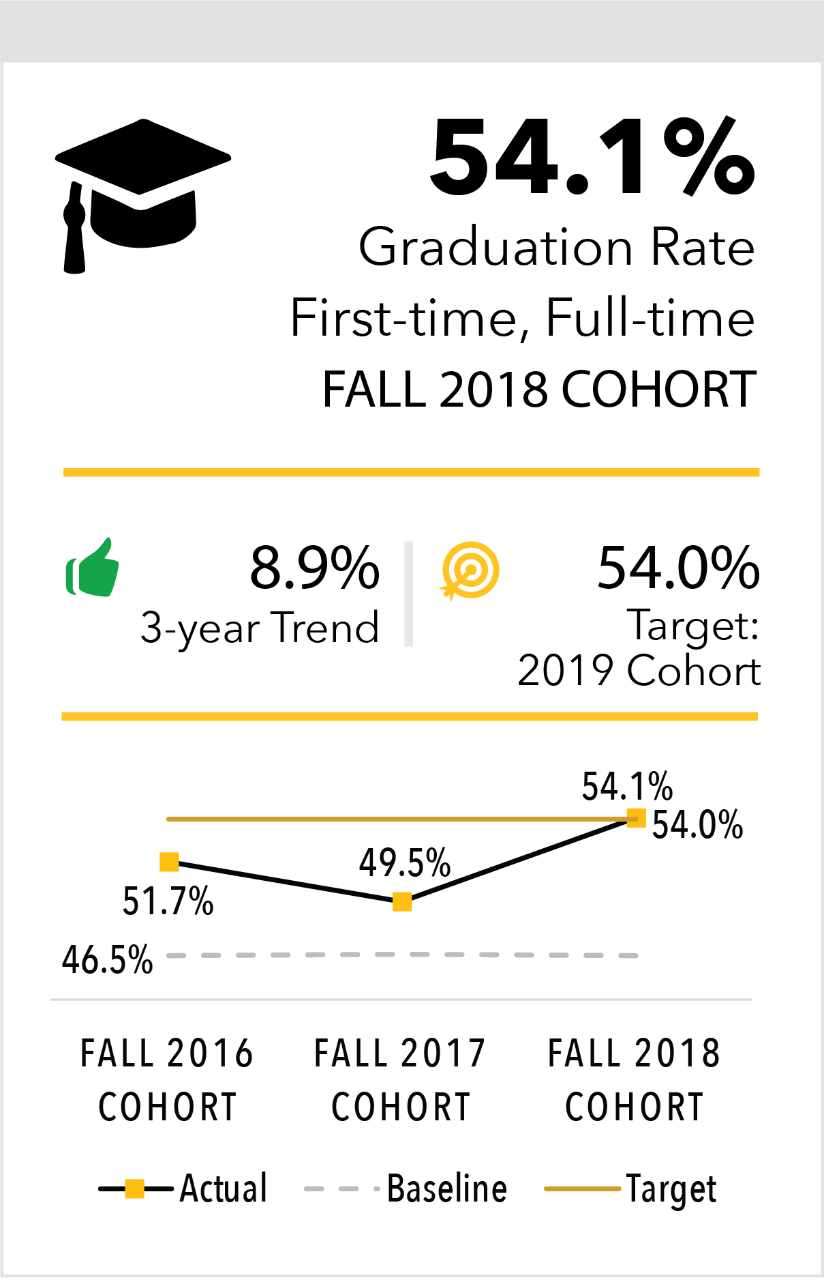
Promote student success and campus culture.
Quality of Interactions
Supportive Environment
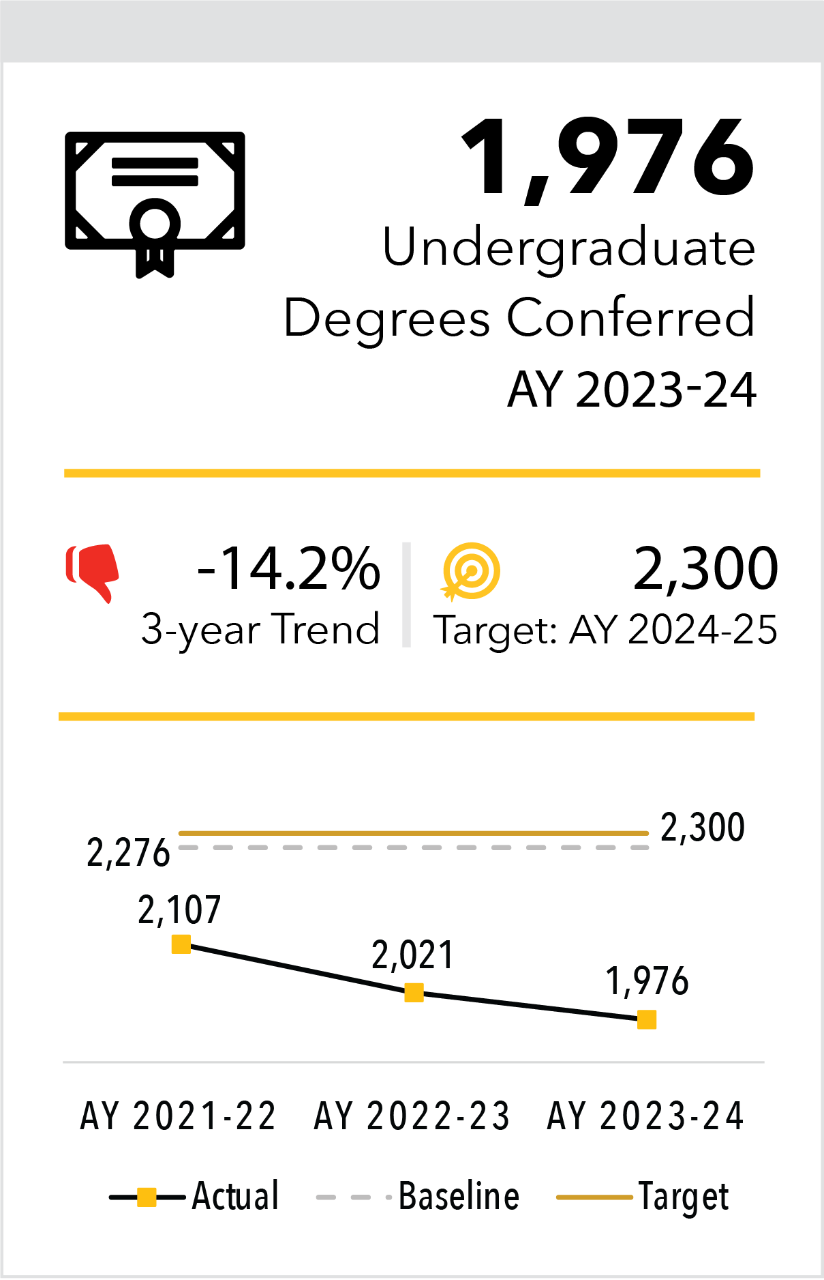
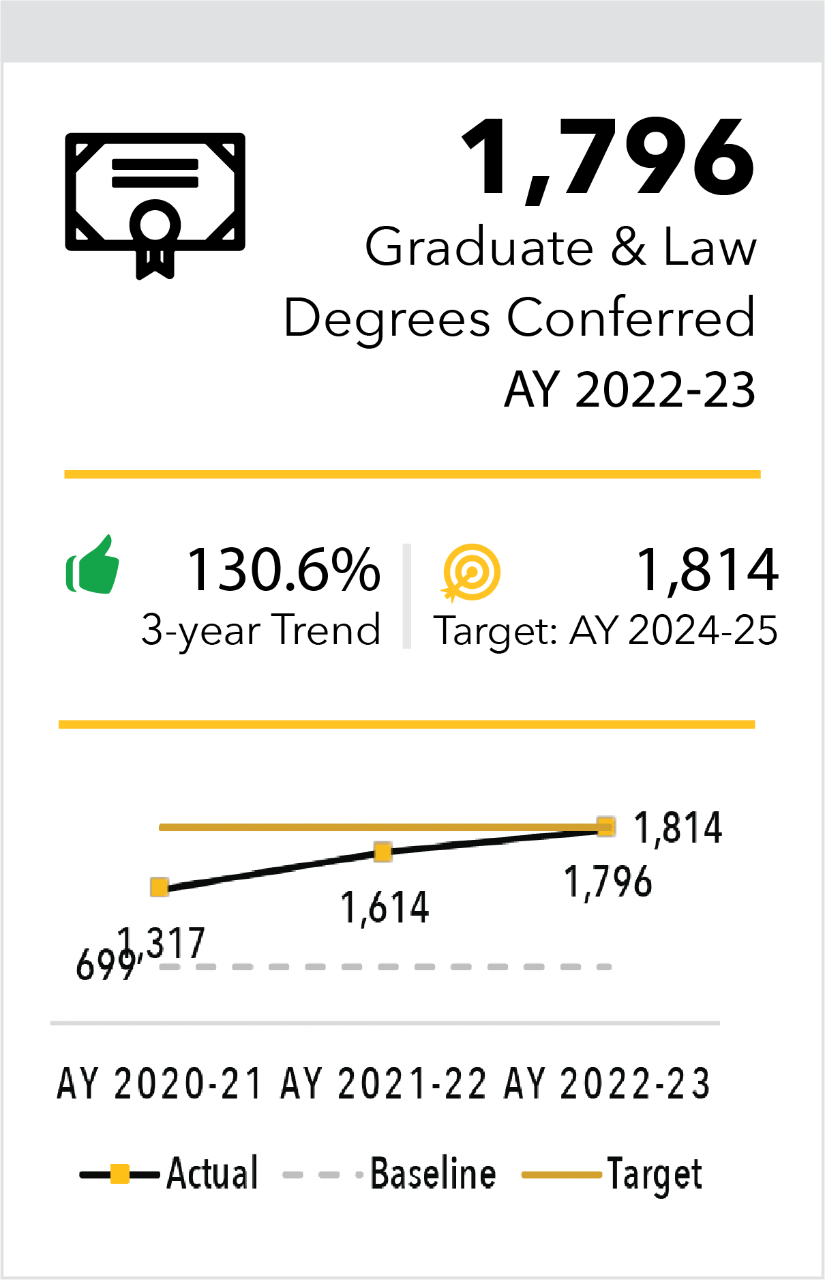
Prepare students for career and lifelong success.
Post-Graduate Outcomes-Employed
Post-Graduate Outcomes-Median Earnings
Our Colleagues
Enhance employee morale, well-being, and professional growth.
Voluntary Turnover Rate
Job Satisfaction and Employee Well-being
Strengthen long-term institutional success.
Cash and Investments
Unrestricted and Auxiliary Net Surplus
Net Tuition Revenue
Healthy Alignment of Personnel Expenses and Net Tuition Revenue
Our Community
Bolster workforce readiness and regional growth.
Internship/Co-Op Participation Rate
Graduates Employed in Region
Drive community engagement and impact.
Voter Registration and Participation
Community Engaged Course Enrollment Rate
P-12 Engagement
Dual Credit Enrollment
Baseline measures will provide a minimum threshold for which the university assesses student achievement through the conclusion of Success by Design in 2025. With the exception of Undergraduate Enrollment, baseline values are determined by the average value of a three-year historical period, which corresponds with the launch of NKU's current strategic plan, Success by Design. The baseline for Undergraduate Enrollment has been calculated on a linear trend of the same time period due to a ten-year negative trend.
Target measures are viewed as aspirational goals, not projected outcomes. Many targets have been predetermined by the Kentucky Council on Postsecondary Education in the Statewide Strategic Agenda (Higher Education Matters, 2022).